TransCO2
This app was created for Gov hack 2022 to track and compair Carbon useage on Public transport. ---- Video ---- Project Home
Planner Space
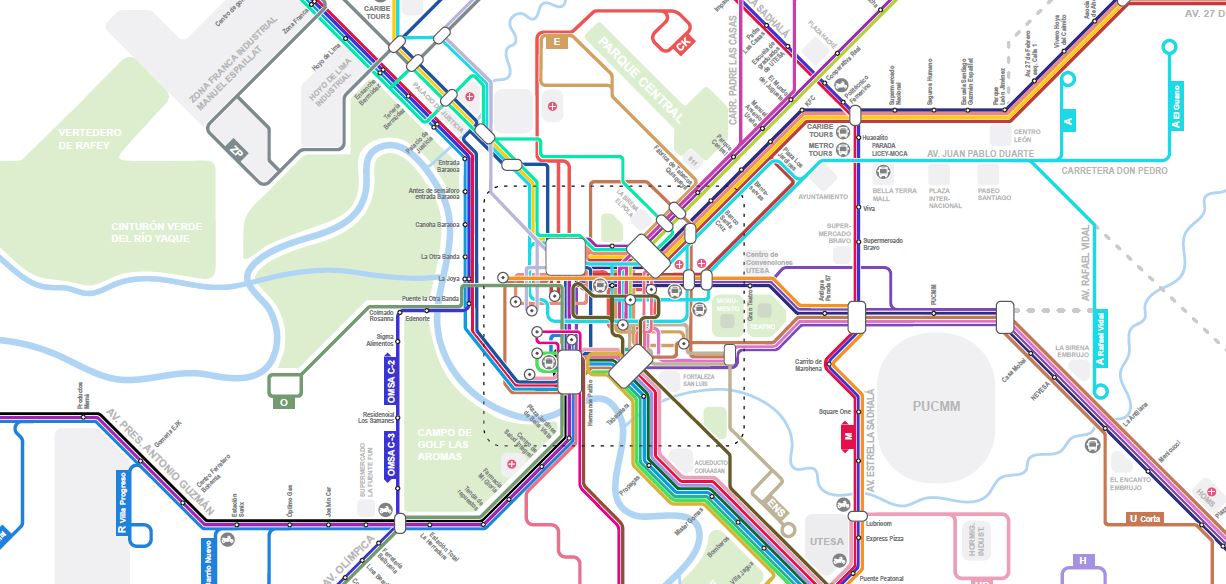
See Below: Canberra’s Most used and CO2 generating Bus routes.
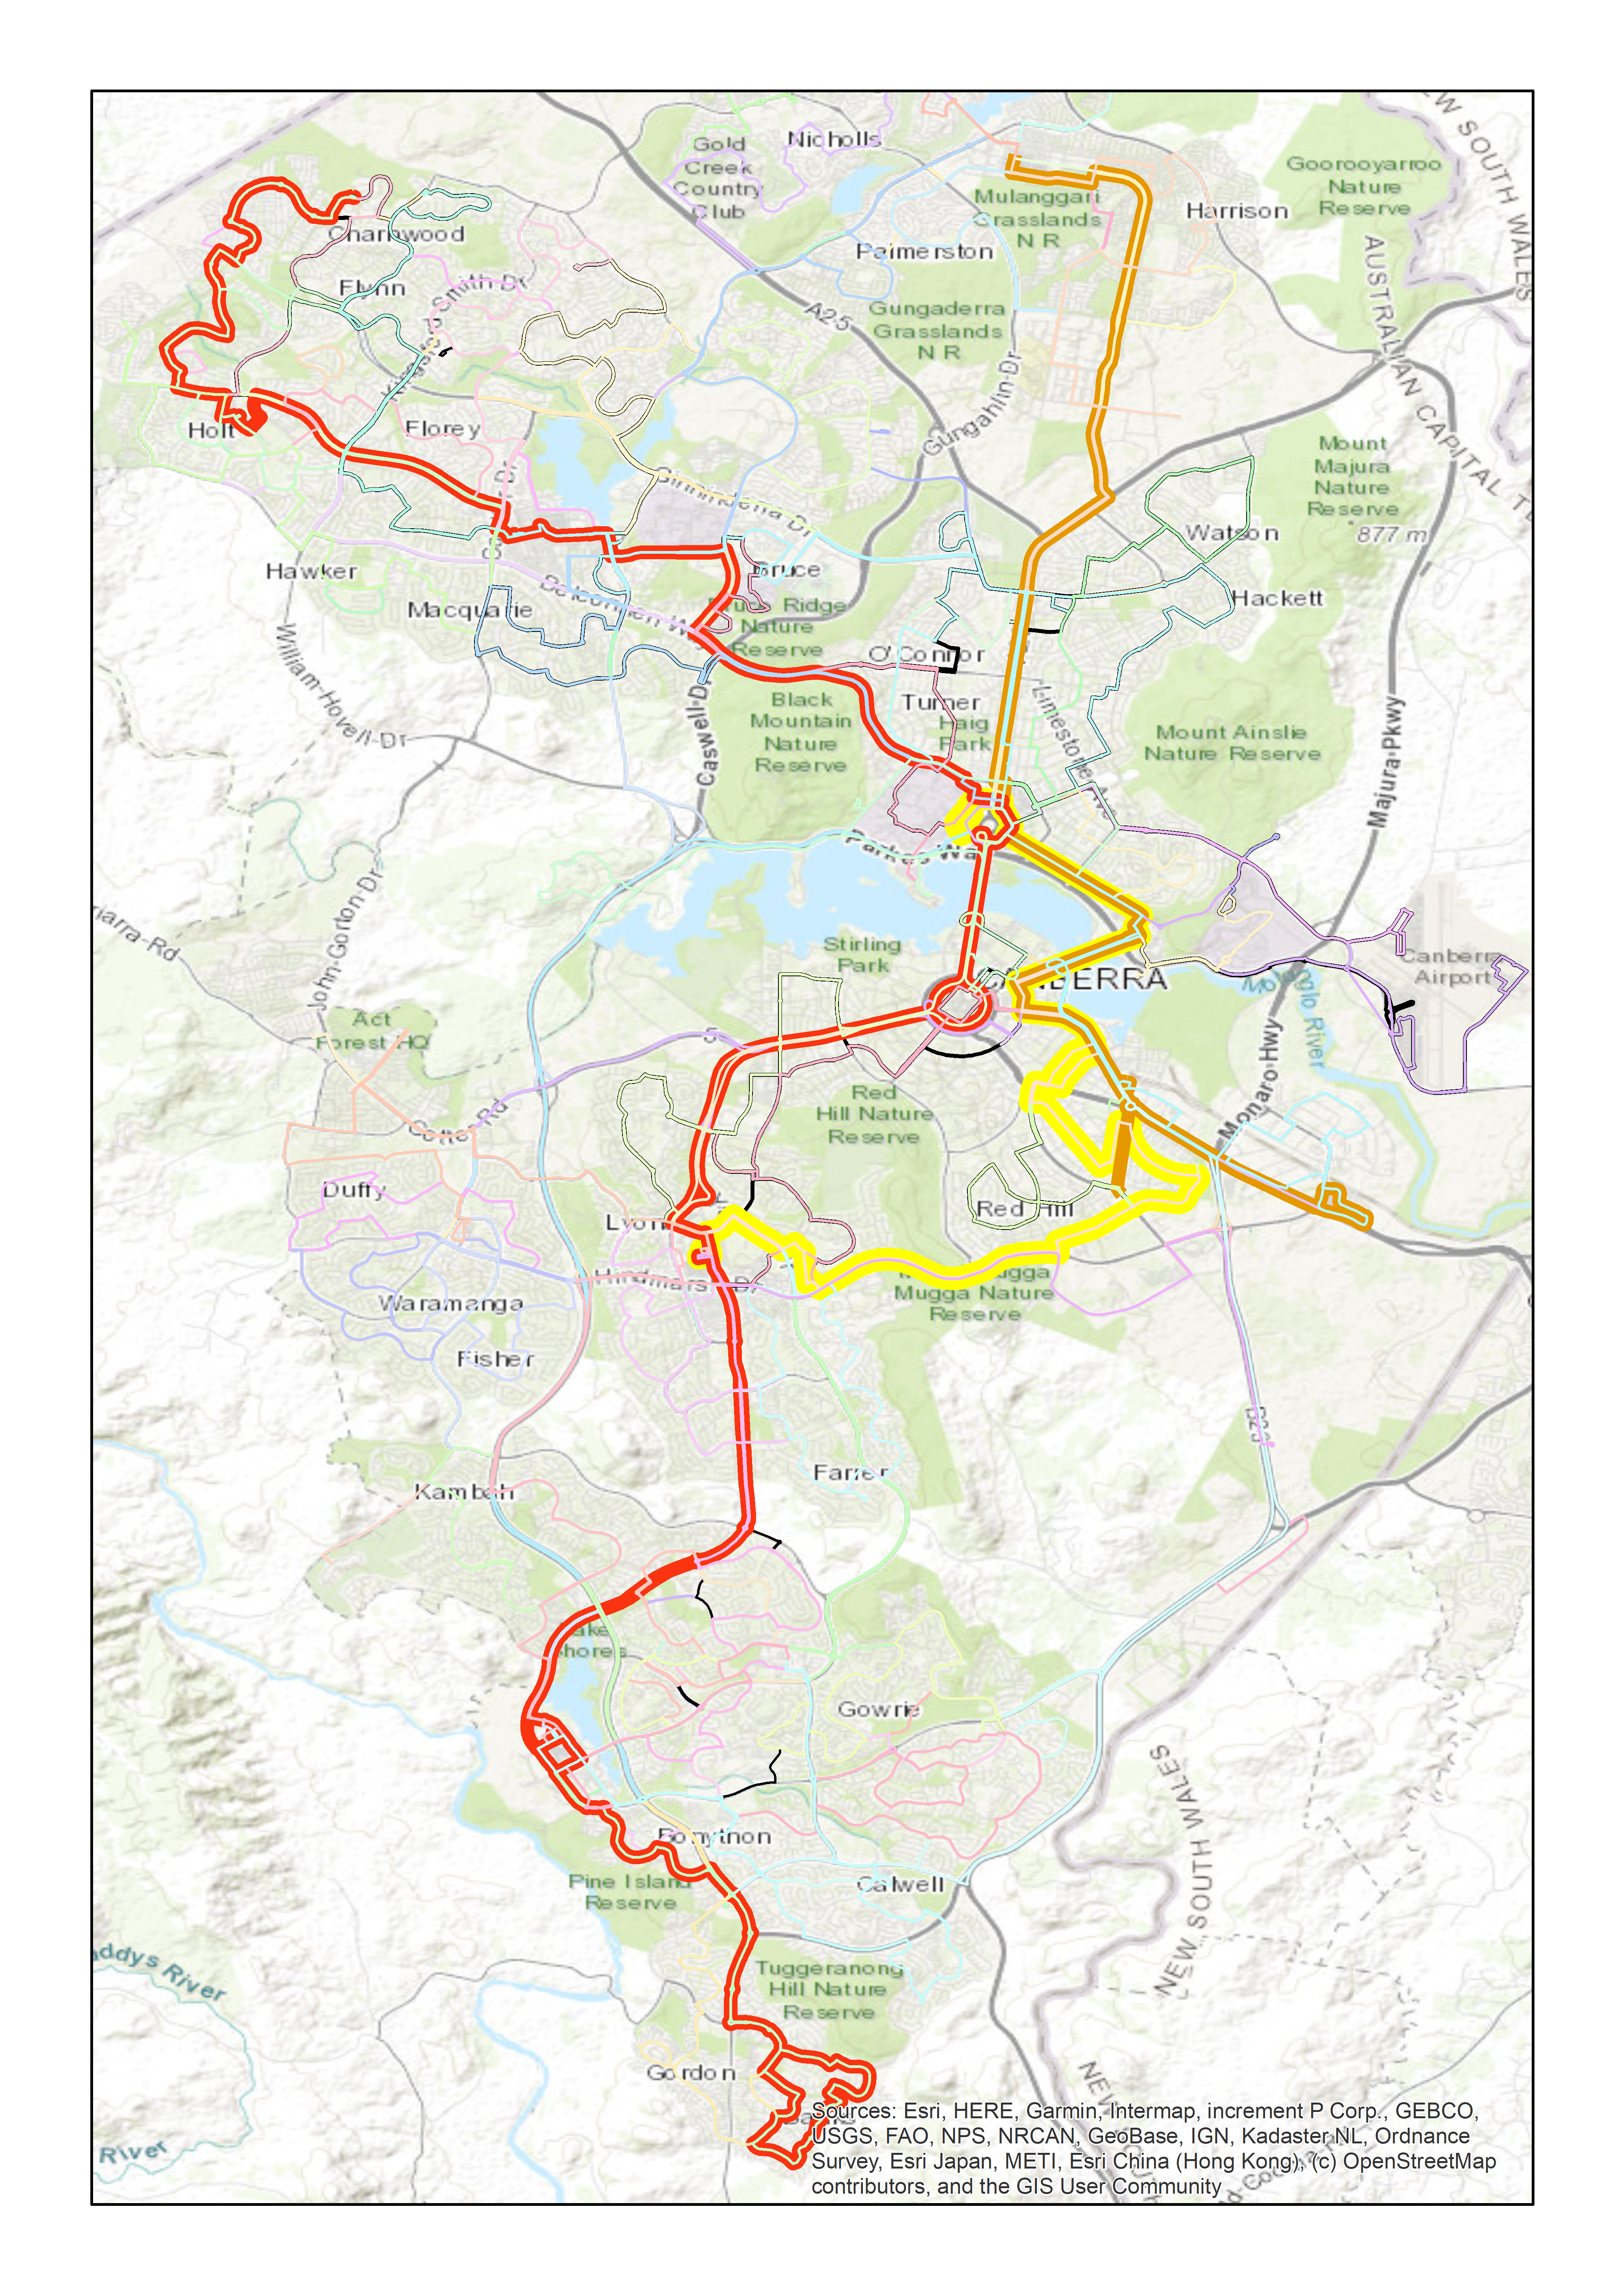
| Route ID | Colour |
|---|---|
| 300 | Red |
| 200 | Orange |
| 005 | Yellow |
Route Summary Table
| Route ID | Revenue per year(Considering OP cost) | Riders per year | Carbon Output (t) per year |
|---|---|---|---|
| 300 | $5,963,472 | 4,018,512 | 1590 |
| 200 | $2,845,683 | 159,798 | 1130 |
| 005 | $494,973 | 27,795 | 1484 |
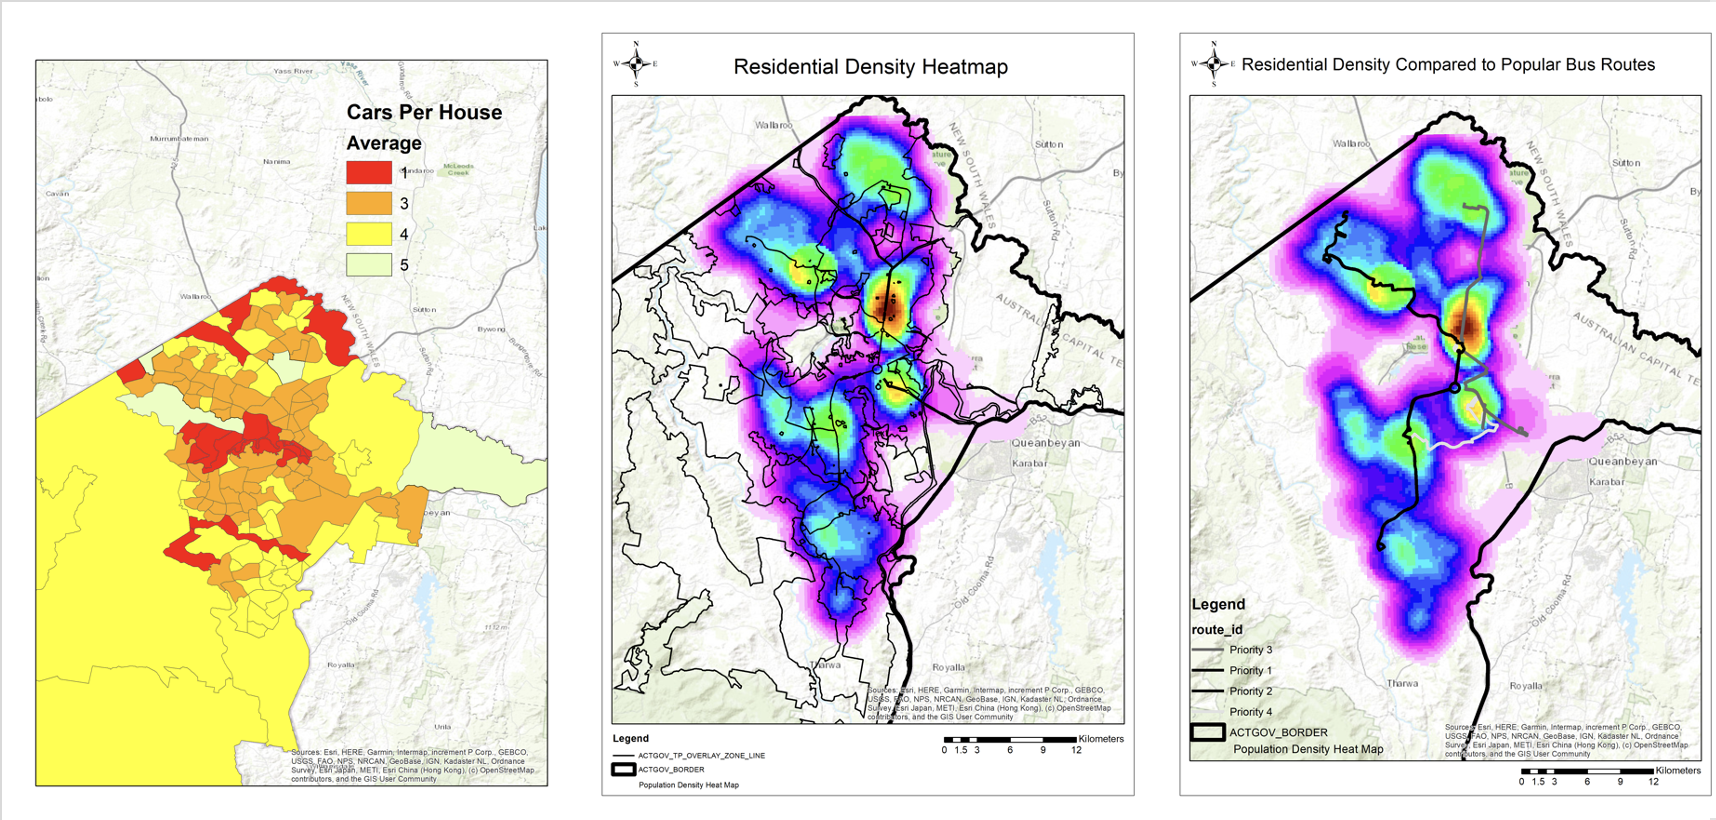
Areas to target
Residential heat Map - Residential heat Map overlaid with Existing Routes - Car per house hold map
Time to pay off the “Electric Switch”
This table displays to route planners how long it would to take to gain benefits from switching to an electric bus at a cost of approximately $3,000,000. This model uses Brisbanes new Metro “bus’ as a case study.
| Route ID | No. of Elec Busses needed | Time to pay off Electric Bus |
|---|---|---|
| 300 | 6 | 8 years |
| 200 | 4 | 10 years |
| 005 | 4 | 55 years |
Want more?
To see this website from a Transport Commuter’s perspective click Here